DPO Radio
Usage Dashboard
Requests and tokens for any period you choose, by provider, model, effort and feature, with the routing in use now and the monthly totals.

When your organisation pays its own AI provider, the provider's invoice tells you what you owe. It does not tell you what produced the bill. A country compliance manager defending an AI budget needs the other half: which features used the tokens, on which model, and at what effort.
The Usage page answers that from Forseti's own record. Every request Forseti sends is written to an append-only usage ledger with its provider, model, effort and token counts. The page reads that ledger for the period you choose and groups it the way a budget conversation needs.
It also answers a question an internal auditor asks: which model handled this work? The page shows the provider, model and effort each feature uses now, and the ones each recent request actually ran on.
The page opens with the active provider and the model and effort each Forseti feature uses now: chat, workflows, tabular reviews, document redlines and titles. Administrators get a link to the AI Model settings beside it.
The current month is shown by default. Choose a start and an end date to change the period. You see the number of requests and the input, output and cached input tokens.
A table breaks the period down by provider, model and effort. This is the table to set beside your provider's invoice for the same dates.
A second table breaks the period down by feature, so you can see whether chat, workflows, tabular reviews, redlines or titles account for most of the tokens.
The most recent requests in the period are listed with time, feature, provider, model, effort and tokens. Administrators see the whole organisation's requests and a by-user table; other people see their own requests.
A history table lists the units consumed in each month, so you can follow the trend across the year.

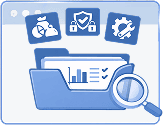
 The provider's invoice shows a total, with no link to the work that produced it.
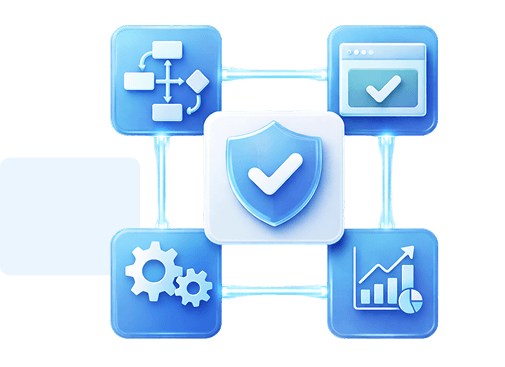
 Requests and tokens for any period, read from an append-only ledger.Nobody can say which features drive the cost.A breakdown by feature shows where the tokens go.A change of model or effort cannot be traced to a change in spend.A breakdown by provider, model and effort sits beside the invoice.An auditor's question about which model handled a draft has no answer.Every recent request names the provider, model and effort it ran on.Trends are rebuilt by hand from invoices each quarter.Monthly consumption shows the trend without rebuilding it.

The figures come from an append-only ledger. Each request is recorded once, with the provider, model and effort it ran on, and the page has no control to change them.

Visibility follows the role. A person who can configure the AI provider sees the whole organisation and the per-user table; anyone else with access to the page sees only their own requests.

The page reports; it does not stop work. No request is refused because a Forseti allowance ran out, because there is no prepaid allowance to run out.
Filter Usage by delegated reading to see the requests and model consumption associated with scoped research helpers. The usage record distinguishes the helper activity from the surrounding chat or workflow.
Ready to see a month of Forseti consumption by provider, model, effort and feature, beside the routing in use today? Request a personalised demo.

Ronni K. Gothard Christiansen - Technical Privacy Engineer & CEO
Technical Compliance Expert, 32+ Years Open Source Advocate, X-BoD Open Source Matters Inc.

Run a 30-day pilot on your own provider account and use the Usage page to see which features your team relies on.

Talk to our team about how the Usage page supports your budget conversations with finance.
Totals of requests and input, output and cached input tokens for the period, then a table by provider, model and effort and a table by feature. Administrators also see a table by user. Recent activity lists individual requests.
Yes. The current month is shown by default. Choose a start and an end date to see any other period, for example the dates on your provider's invoice.
Yes. The page shows the provider, model and effort each feature routes to now, and the ones each recent request ran on. Your organisation chose them on the AI Model page.
Not directly. It shows Forseti's own count of requests and tokens. Your provider applies its own prices and issues the invoice, and its figures are what your organisation pays.
Yes. Light, Standard and Enterprise all include it. People who can configure the AI provider see the whole organisation; other people with access see their own requests.


The evolution of Aesir is Aesir +  (the Norse symbol for Necessity)"Needed in order to achieve a particular result"
♥Join the AesirX Privacy Newsletter. Stay Informed. Stay Compliant.