DPO Radio
AesirX Features: User Experience Flow

![]() USER EXPERIENCE FLOW
USER EXPERIENCE FLOW
See Every User Journey and Know Which Ones Create Real Value
Turn chaotic user paths into scored journeys that highlight what drives engagement and meaningful outcomes.

Why User Experience Flow Matters
Most analytics tools scatter data across dashboards that track page views, bounce rates, and isolated events without explaining the human journey behind them, which means you never get true journey analytics. You see fragments of behavior, not the flow that led to a conversion or failure point. Teams waste time guessing which paths matter, what actions influence results, and where users lose interest because no single view connects the dots. Complex user experiences become guesswork, and decisions rely on assumptions instead of evidence.
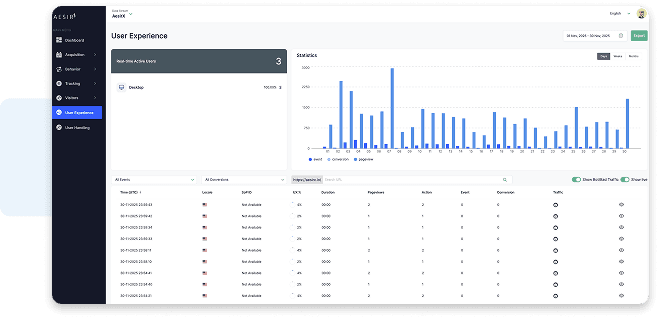
AesirX User Experience Flow closes that gap by turning every session into a visual journey of how people move through your site. Each flow combines actions, events, conversions, and tag-driven engagement values together with the metric values you assign to key Tag Events into a single Engagement Score that reflects both real user interest and business impact. With UTM Value Mapping, campaign intent directly shapes these scores and the ranking of flows, so the most valuable journeys surface first. You can still see the underlying metric value for each interaction, giving clear context about which touchpoints truly matter. All data remains first-party, consent-gated, and tied to your own infrastructure.
This creates a practical business advantage. You can identify high-performing patterns, locate friction points, and invest resources where engagement and fiscal impact are highest, rather than chasing vanity metrics.
Trusted by Organizations Across Industries
Built for organizations where data protection meets performance

Agencies
Identifies flows that drive profitable user actions.

E‑commerce & Retail
Maps journeys from product view to checkout.

Financial Services
Tracks multi-step onboarding behaviour paths.

Publishing & Media
Highlights content paths that keep readers engaged.

Public Sector & Education
Shows navigation patterns for key resources.

Healthcare
Reveals pathways that lead to appointment requests.

Legal Services
Exposes steps users take before consultation interest.

Travel & Hospitality
Visualizes paths from inspiration to booking.
User Experience Flow Features
Engagement Scoring
Turns actions and events into a single score that reflects real user interest and value.
Every journey receives a unified Engagement Score that reflects how meaningful the visitor’s interactions were. Actions, events, and conversions are combined with Tag Value Mapping signals into a single engagement score so you can compare journeys consistently. In parallel, when a journey contains events with assigned metric values (in a currency like USD), those values are summed into a separate Value Attribution total. This gives you two clear views side by side: how engaged the user was, and how much business value that journey is estimated to have generated.
UTM-Adjusted Flows
Ranks flows based on campaign value so high-impact journeys rise to the top.
UTM Value Mapping works on the full UTM combination for an incoming visitor (source + medium + campaign, etc.), treating it as a single mapped UTM. For each mapped UTM, you can define:
- an engagement contribution that is added to the journey’s total Engagement Score, and
- a metric value contribution (in currency) that is added to the journey’s total value attribution.
When a session arrives with matching UTM data, its entire journey inherits these contributions. Engagement from the UTM is added to the Engagement Score; value from the UTM is added to the total metric value. When you sort flows by Engagement Score or by metric value, journeys from stronger UTMs naturally rise to the top.
Drop-Off and Conversion Paths
Shows where users hesitate or exit, so you can fix friction before revenue is lost.
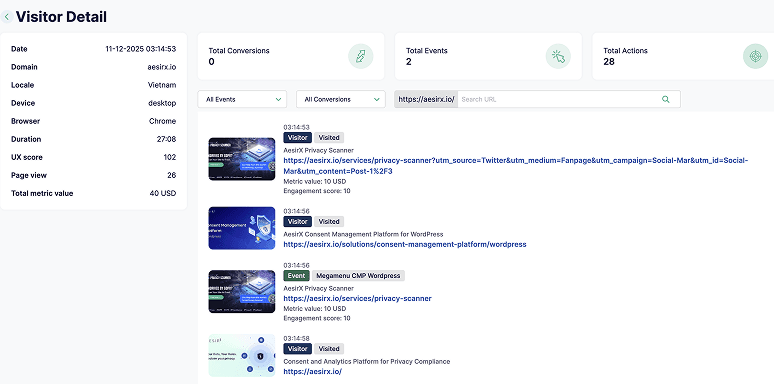
Each journey is visualised step by step, pulling in OG metadata to show pages and actions as recognisable cards in the flow. You see how visitors enter, which pages and events they move through, and where key interactions happen. From there, UX Flow highlights two critical points: where conversions occur and where sessions drop off. For each step, you can see its contribution to the overall Engagement Score, and when metric values are present, which parts of the path carry the most attributed value. That makes it easy to spot friction, reinforce what works, and strengthen the paths that consistently lead to results.
Compare the Difference
Without User Experience Flow

WithUser Experience Flow
Work on the paths that matter most.
Proof That It Works
1Trust Checklist
 High-value journeys
 Clear priorities
 Real behaviour clarity
2Release Highlights

AesirX Analytics v1.0.1: Tag Event Value Mapping and Full-Flow Metric Scoring
AesirX Analytics v1.0.1 adds Tag Event Value Mapping: assign metric and engagement values to first-party Tag Events directly in the Tag Manager
READ MORE
AesirX Analytics v1.0.0: Introducing UTM Value Mapping
AesirX Analytics v1.0.0 introduces UTM Value Mapping to assign real monetary value to campaigns using first-party data, without third-party trackers.
READ MORE
Measure value, Not just traffic
Measuring value, not traffic, reframes analytics around outcomes. It highlights which journeys and campaigns create real business impact instead of empty activity.
READ MORE


People Also Ask
AesirX User Experience Flow doesn’t just count pageviews or events; it turns every consented session into a visual journey. Each journey is shown as a structured flow using OG metadata (titles, images) so you can immediately see where people start, what they do, where they drop off, and where they convert. On top of that, each journey gets a separate Engagement Score and metric value, so you see both behaviour and business impact instead of just raw traffic.
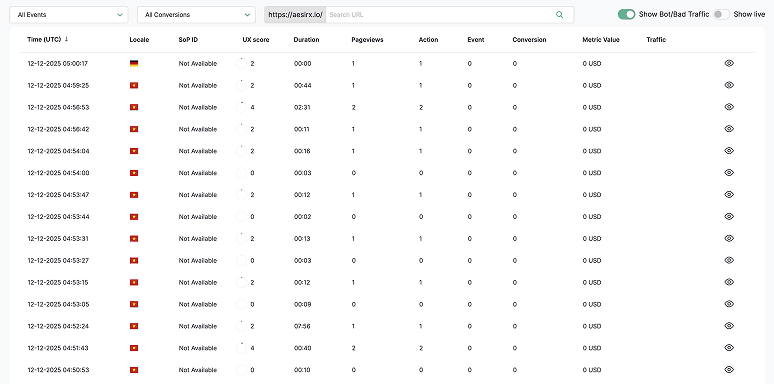
UX Flow tracks pageviews, actions, events, Tag Events, and conversions for every consented session. These are displayed as a step-by-step flow, with Engagement Score and any currency-based metric value attributed along the path. You can also filter out bot or bad traffic, focus purely on genuine users, and use Show Live to watch active journeys update in real time.
They are two separate signals:
- Engagement Score - a weighted engagement metric based on actions, events, conversions, tag values, and (where configured) UTM engagement contributions. It shows how meaningfully someone interacted, independent of money.
- Metric value - a currency-based attribution (e.g. USD) that sums metric values from Tag Events and UTM Value Mapping. It shows how much estimated business value that journey generated.
Every journey can show both side by side, so you can spot sessions with high engagement but low value (or the opposite) and optimise accordingly.
UTM Value Mapping works on the combined UTM data of an incoming session (source + medium + campaign, etc.), treated as a single mapped UTM. For each mapped UTM, you can define an engagement contribution and a metric value contribution. When a session matches that UTM combination, those contributions are added to its Engagement Score and/or total metric value. This makes it easy to see which campaigns drive the most engaged journeys, which drive the most value, and which flows you should prioritise for optimisation.
Start by sorting journeys by metric value to see which flows create the most business impact, then look at their Engagement Scores and step-by-step paths. Compare those to journeys with high engagement but low value, and use Drop-Off and Conversion Paths to spot where people hesitate or abandon. From there you can:
- Strengthen the steps that appear in your best-performing flows,
- Fix or simplify steps where high-engagement journeys frequently drop off, and
- Adjust campaigns and landing pages so more users follow the paths that consistently lead to value.
UX Flow turns journey analytics into a practical optimisation map, showing you exactly which paths to protect, which to fix, and which aren’t worth investing in.
The evolution of Aesir is Aesir + ![]() (the Norse symbol for Necessity)"Needed in order to achieve a particular result"
(the Norse symbol for Necessity)"Needed in order to achieve a particular result"
♥Join the AesirX Privacy Newsletter. Stay Informed. Stay Compliant.


