DPO Radio
Dashboard

![]() DASHBOARD
DASHBOARD
Your GRC Command Center, Configured for the Way You Work
See your entire compliance program at a glance. 13 widgets. One framework filter. Your layout, your role, your data.

Why the Dashboard Matters
Enterprise compliance work is distributed across dozens of simultaneous activities: open data subject requests approaching their statutory deadlines, active incidents under breach notification review, pending DPIA approvals, vendor risk assessments awaiting sign-off, and monitoring tasks overdue for completion. Compliance leads and internal audit teams need a real-time view of this entire landscape before they can prioritize their team's work. Without it, they must open each module individually, pull separate reports, and mentally consolidate the status of activities that the platform already tracks.
The cost of this fragmentation is not just inconvenience. When a DPO cannot see at a glance that three rights requests are within 48 hours of their statutory deadline, those deadlines slip. When a Cybersecurity Lead cannot see breach notification status alongside their incident workload, coordination gaps appear. When a Breach Response Lead must navigate five modules to understand whether remediation is on track, response time suffers. When leadership needs a compliance health summary for a board presentation, it takes hours to compile data that the platform already holds.
The Dashboard solves this by aggregating the most operationally relevant data from every active module into a single configurable view. Every widget, filter, and section is organized around how compliance work actually breaks down, so the right information reaches the right person without manual consolidation.
Every team member can also personalize their layout based on their role. A department data owner does not need AI governance or vendor risk widgets in their daily view. A breach response lead does not need data coverage status front and center. Each person's configuration is saved automatically, so their layout is ready when they return without affecting anyone else's view.
How It Works
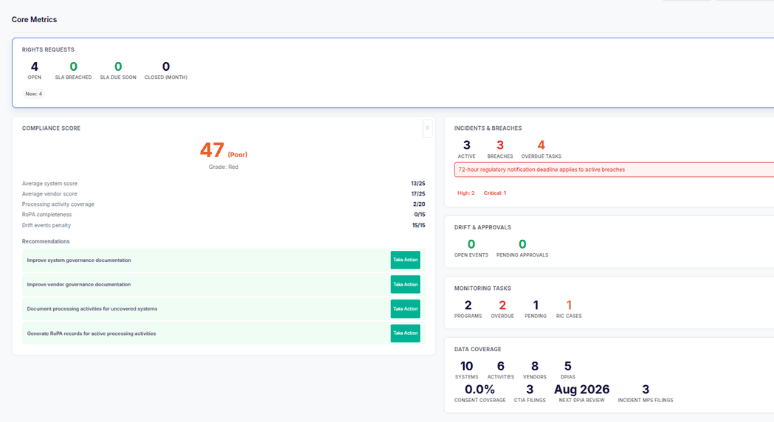
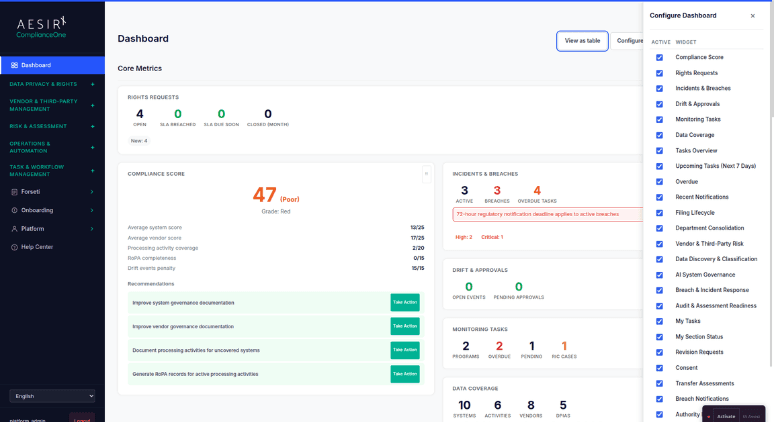
Core Metrics Section
The first collapsible section shows the highest-level health indicators: compliance score, rights request SLA status, active incidents and breaches, pending approvals, drift alerts, and overdue monitoring tasks. Five widgets give compliance leadership a top-line program view without opening any individual module.
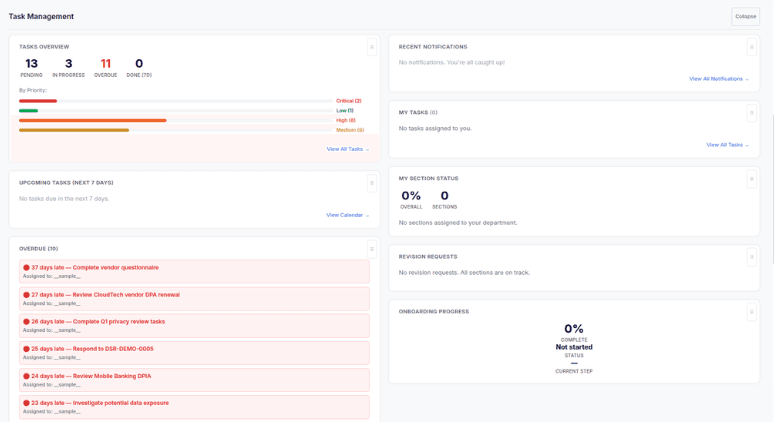
Task Management Section
The second section surfaces active workload: data coverage across systems, activities, vendors, and DPIAs, alongside upcoming and overdue monitoring review items. Team leads use this section to see what is in progress and what is at risk before directing their team's attention.
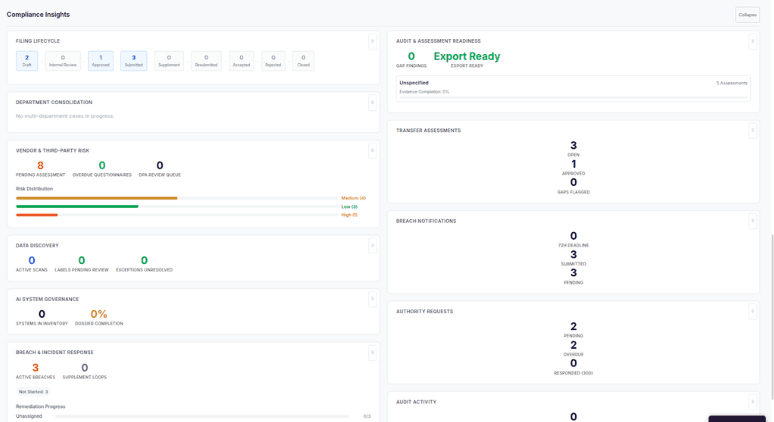
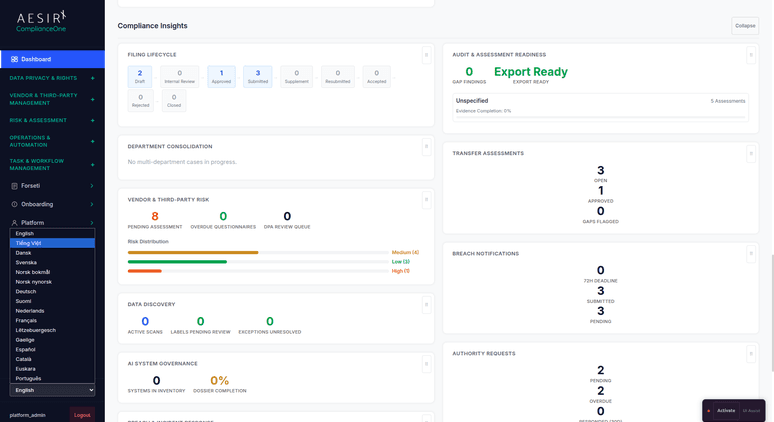
Compliance Insights Section
The third section contains seven specialized widgets for deeper visibility: filing pipeline status, department consolidation progress, vendor risk exposure, discovery scan results, AI governance posture, breach tracking through the notification lifecycle, and audit readiness scoring for upcoming regulatory inspections.
Widget Configuration Panel
Accessed via the "Configure Dashboard" button, the panel lets users toggle individual widgets on or off. Widgets are tier-aware, so only widgets relevant to the modules available in the organization's tier are installed and visible. Show, hide, and collapse preferences are saved per user in localStorage, so each team member's layout is ready when they return without affecting anyone else's view.
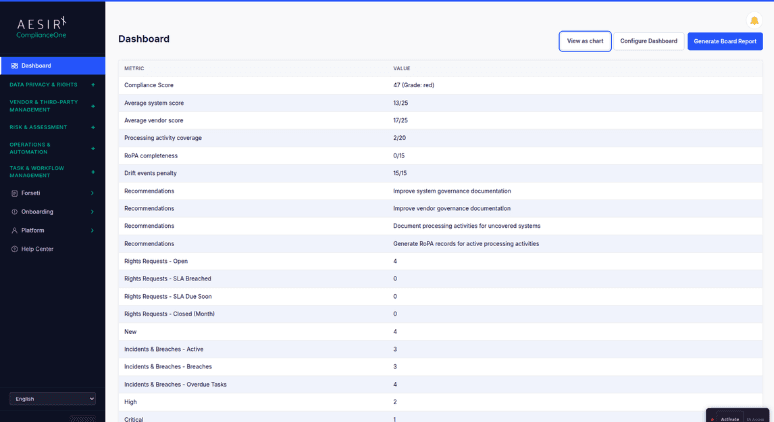
Universal Table View
Widgets that display cards or summary tiles offer a "View as table" toggle, positioned consistently next to the "Generate Board Report" button. The table view exposes row-level data for users who need to scan line items, export specific records, or review details at full granularity.
Bilingual and Multi-Locale Support
Fully supported across 16 locales, so international teams and Vietnamese-language users work in the same platform without separate configuration. All labels, widget headings, status indicators, and board reports render in each user's configured language across Vietnamese, English, and 14 additional locales.
Compare the Difference
Without the Dashboard
With the Dashboard
Built for Real Compliance Operations

The Dashboard aggregates data from every active ComplianceOne module through a single API call, giving compliance teams one place to see health, risk, and workload across 13 purpose-built widgets.

A single framework filter scopes all 11 framework-aware widgets simultaneously, so teams working across VN PDPL, Cybersecurity Law, and other frameworks can shift their entire view with one selection.

Full i18n support across all 16 ComplianceOne locales ensures every team member sees dashboard data in their configured language from day one.


See the Dashboard in Action
Ready to see how the Dashboard surfaces compliance health, pending tasks, and regulatory status in a single configured view? Request a personalized demo.

Ronni K. Gothard Christiansen - Technical Privacy Engineer & CEO
Technical Compliance Expert, 32+ Years Open Source Advocate, X-BoD Open Source Matters Inc.
People Also Ask
The Dashboard includes 13 widgets organized into three collapsible sections: Core Metrics, Task Management, and Compliance Insights. Users can show or hide individual widgets through the Widget Configuration Panel.
It applies to all 11 framework-aware widgets simultaneously. Switching frameworks updates every eligible widget in a single action. Two widgets are framework-agnostic and remain unaffected.
Yes. Each user's show, hide, and collapse preferences are saved independently, so every team member can maintain a layout matched to their role without affecting anyone else's view.
Every widget includes a "View as table" toggle next to the "Generate Board Report" button. It converts any widget to a row-level table view for scanning line items, exporting records, or reviewing data at full granularity.
Yes. The Dashboard is included in every ComplianceOne package from Light upward. No additional configuration or licensing is required.
Next Steps
Explore the module architecture, then speak with us about the workflows your organization needs to operationalize first.

Start a Compliance Pilot
Run your Dashboard against real regulatory obligations in a structured pilot environment.

Discuss Your Compliance Needs
Walk through your team's compliance monitoring requirements with a specialist.

The evolution of Aesir is Aesir + ![]() (the Norse symbol for Necessity)"Needed in order to achieve a particular result"
(the Norse symbol for Necessity)"Needed in order to achieve a particular result"
♥Join the AesirX Privacy Newsletter. Stay Informed. Stay Compliant.


