DPO Radio
AesirX Features: Analytics Dashboard and KPIs

![]() ANALYTICS DASHBOARD AND KPIS
ANALYTICS DASHBOARD AND KPIS
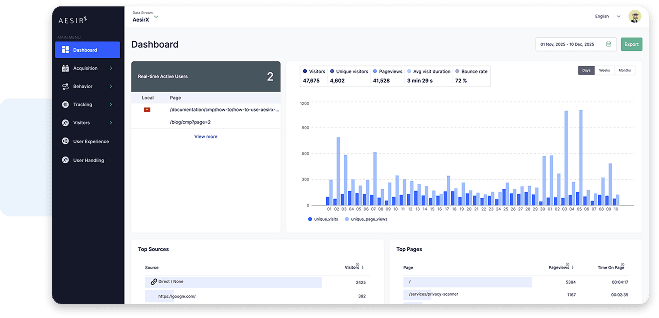
See the Metrics That Matter, From One First-Party Dashboard
Get actionable KPIs from UX Flow, campaigns, behaviour, and visitors in a single view, without exporting data or relying on external BI tools.

Why Analytics Dashboard and KPIs Matter
Most analytics platforms overwhelm users with dozens of reports and graphs, leaving teams unsure where to look or what to act on first. Important insights hide behind layers of navigation, each tool presents data differently, and dashboards often rely on third-party identifiers that risk data leakage.
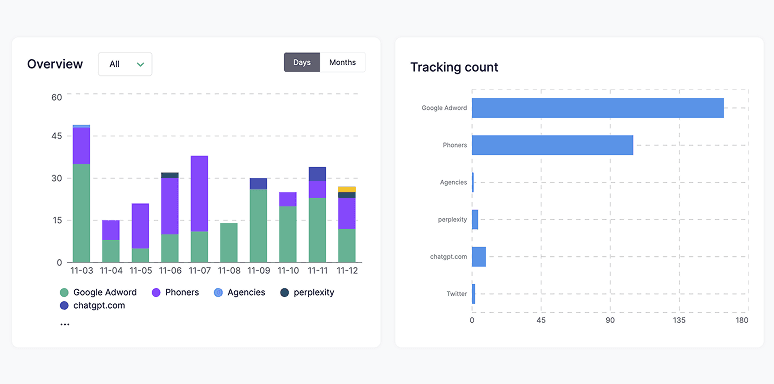
The AesirX Analytics Dashboard and KPIs solves this by surfacing the metrics that actually change decisions. The dashboard consolidates first-party data from UX Flow Analytics, Acquisition and Campaign Analytics, Behavior Analytics, Tracking, Visitor insights, and optional eCommerce signals into one starting point.
Every card highlights a meaningful KPI – top campaigns, high-engagement flows, conversion signals, priority pages, and visitor context – turning analytics into a clear daily briefing. Instead of guessing what matters, teams immediately see where to focus, and can dive deeper with a single click.
Trusted by Organizations Across Industries
Built for organizations where data protection meets performance

Agencies
Provides one view to prioritize client performance work.

E‑commerce & Retail
Surfaces store KPIs without complex BI setups.

Financial Services
Highlights onboarding friction at the top level.

Publishing & Media
Shows which content retains or loses readers.

Public Sector & Education
Summarizes access patterns for services.

Healthcare
Quickly reveals interest in key services or pathways.

Legal Services
Exposes enquiry drivers at a summary level.

Travel & Hospitality
Presents booking and journey readiness signals.
Analytics Dashboard and KPI Features
Analytics Dashboard
Your central view of KPIs that show what’s happening right now.
The Dashboard unifies traffic, campaigns, UX Flows, key pages, repeat signals, and conversion highlights into one first-party view, with each insight linking to its deeper feature.
Compare the Difference

Without Analytics Dashboard and KPIs

WithAnalytics Dashboard and KPIs
Start where decisions begin.
Proof That It Works
1Trust Checklist
 Shared view
 Actionable KPIs
 Instant prioritisation
2Release Highlights

AesirX Analytics v1.0.1: Tag Event Value Mapping and Full-Flow Metric Scoring
AesirX Analytics v1.0.1 adds Tag Event Value Mapping: assign metric and engagement values to first-party Tag Events directly in the Tag Manager
READ MORE
AesirX Analytics v1.0.0: Introducing UTM Value Mapping
AesirX Analytics v1.0.0 introduces UTM Value Mapping to assign real monetary value to campaigns using first-party data, without third-party trackers.
READ MORE
Measure value, Not just traffic
Measuring value, not traffic, reframes analytics around outcomes. It highlights which journeys and campaigns create real business impact instead of empty activity.
READ MORE

14-day Free Trial
Run it on your website and see how it works for you
View Analytics Benefits & Options
People Also Ask
The AesirX Analytics Dashboard brings UX Flow, campaign, behaviour, and visitor KPIs into a single first-party view so teams know where to focus without checking multiple reports.
It depends. The Analytics Dashboard gives a top-level BI summary using your own first-party data, so many teams no longer need external dashboards for daily insight.
Each KPI card links to the relevant feature, UX Flow, Behavior Analytics, Acquisition, Tracking, or Visitors, making the dashboard a starting point, not a silo.
No. The Analytics Dashboard uses aggregated, first-party signals. It provides insights without exposing individuals, identities, or cross-site identifiers.
Yes. If WooCommerce integration is active, the dashboard can surface product and revenue-related KPIs alongside flows, campaigns, and visitor metrics.

The evolution of Aesir is Aesir + ![]() (the Norse symbol for Necessity)"Needed in order to achieve a particular result"
(the Norse symbol for Necessity)"Needed in order to achieve a particular result"
♥Join the AesirX Privacy Newsletter. Stay Informed. Stay Compliant.


