
Imagine you're sifting through a mountain of LEGO bricks, searching for the perfect pieces to build your masterpiece. That's what decision-making feels like in our world flooded with data.
Enter data visualization tools.
Like a skilled LEGO master turning a chaotic pile into an awe-inspiring castle, these tools transform overwhelming data streams into clear visuals.
We’ll explore how these tools can elevate our decision-making game, making sense of the data deluge with ease.
The Impact of Visualization on Decision Making
1. Clarity and Understanding
Data visualization tools change complex data into simple visuals like charts, graphs, and maps. This makes it easier to see and understand detailed patterns and trends. With a clearer view of the data, making informed decisions becomes much simpler.
2. Quick Analysis
Visuals help decision-makers understand lots of information quickly. This fast understanding is crucial in fast-paced environments such as financial markets.
3. Revealing Hidden Insights
Often, the true story behind the data is not apparent until it’s visualized. Data visualization tools can reveal patterns and connections you might miss in regular reports, sparking new ideas and approaches.
4. Better Communication
Data visualization and reporting make it easier to communicate findings with stakeholders, regardless of their data literacy levels. A well-designed chart can convey the message more effectively than pages of spreadsheets, making it easier to work together and agree on decisions.
5. Less Mental Strain
Visual data means less brain power spent on sorting through information. This lets decision makers focus on understanding the big picture and making strategic choices, instead of getting stuck on data details.
6. Data-Driven Decisions
Visualization tools help create a culture that values data-based decisions by showing clear, factual insights. This leads to choices based on solid evidence, which are usually more consistent and successful.
The Power of AesirX BI for Informed Decision Making
AesirX BI offers clear, compliant, and actionable insights from complex data. Here’s a closer look at how it transforms and visualizes data to support informed decisions:
Compliance with data protection laws
AesirX Analytics collects data from user interactions, which is then processed and presented in the AesirX BI dashboard in an engaging visual format. This integration guarantees compliance with GDPR and CCPA regulations through innovative methods:
- Using first-party data directly sourced from your audience eliminates the need for third-party cookies.
- Implementing a 4-tier decentralized consent model, powered by AesirX Shield of Privacy and Concordium blockchain technology, to give consumers control over data collection.
By adopting these advanced methods, AesirX BI delivers actionable insights while maintaining user privacy and ethical data collection and storage.
Concerned that your website violates data protection laws? Scan free now to confirm!
Making data work for your strategy
AesirX BI lets users customize the software, analytics, and reports to focus on key metrics. This includes:
- Unlimited Frontend Customization: Use the open-source Progressive Web App (PWA) framework to tweak the interface and align it with your business processes.
- Tailored Metrics: Choose relevant data points like website traffic, user behaviors, or marketing campaign performance.
- Reports Your Way: Create custom reports that reflect your unique goals. Ensures that reporting is not only relevant but also directly influences strategic decision-making.
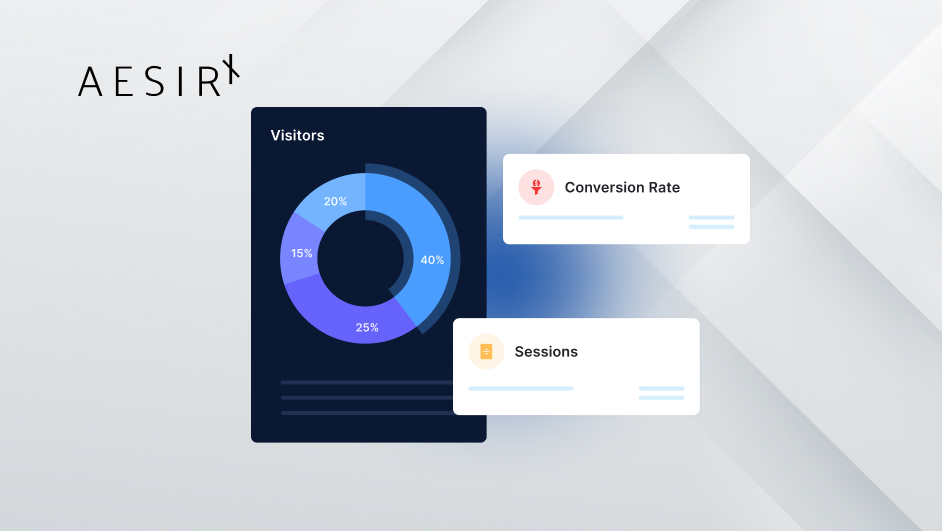
Bringing data to life
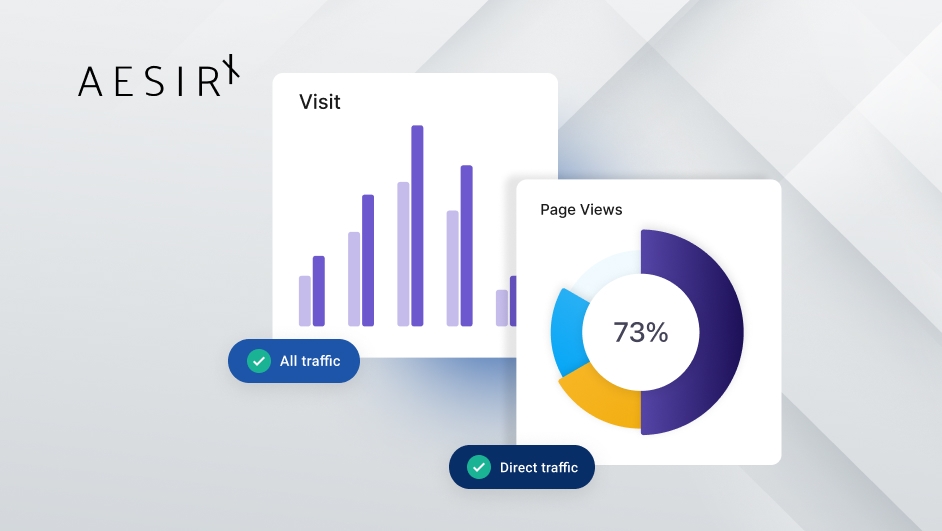
The platform offers various interactive data visualization options:
- Charts and Graphs: Traditional visual formats that are ideal for comparing figures and identifying trends.
- Geospatial Data: Dive into detailed location analysis and break down information by demographics.
- Real-Time BI Dashboards: As your business evolves, so can your analytics. Adjust your dashboards in real time to ensure your insights remain relevant and actionable.
So, just as a skilled LEGO master turns a chaotic pile of bricks into a magnificent castle, data visualization tools like AesirX BI transform the overwhelming flood of data into clear visual stories. These tools aren't just about beautifying data; they're crucial for making informed decisions. By utilizing these technologies, organizations can sift through the vast amounts of data, uncovering insights that are not only clear and compliant but also ethical. This process fosters both progress and innovative thinking.
Ready to unlock AesirX BI's potential for informed decision-making? Get started with our free edition today and drive your business forward with actionable insights!